The Idea
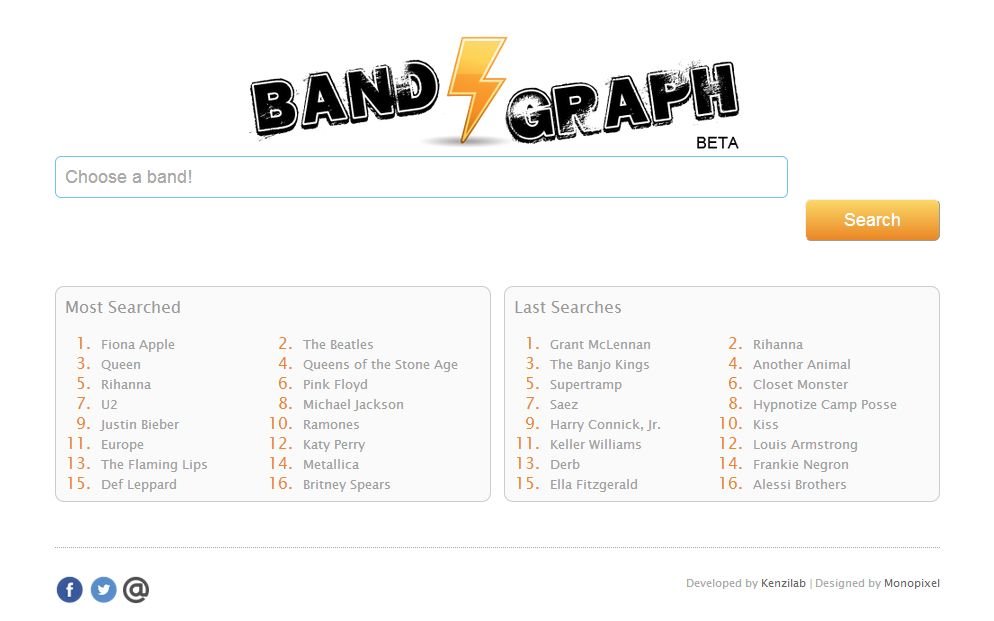
Music doesn’t exist in a vacuum—every artist influences and is influenced by others. I wanted to make these invisible connections visible. Band Graph turned musical influence relationships into an interactive force-directed graph where you could explore how your favorite bands connected to the entire music ecosystem.
Building It
The technical challenge was interesting: I needed data for 900,000+ artists, but I couldn’t afford to store or maintain that myself. The solution was to use MongoDB as an intelligent caching layer between public music APIs and users. First request? Fetch from the API and cache it. Every request after that? Instant from MongoDB.
This architecture let me serve 2,000 daily users with minimal infrastructure costs. The cache grew organically based on what people actually searched for, and popular artists were always fast.
The visualization used D3.js with force-directed graph layouts. Click an artist, and their influences and influenced artists would expand outward. The physics simulation naturally clustered related artists together, creating an intuitive, explorable map of musical relationships.
The SEO Success
Band Graph ranked #1 for virtually any “artist influences” search. This wasn’t luck—it was deliberate:
Server-side rendering meant search engines saw full HTML. Every artist had a dedicated page with semantic URLs. The 900K artist database naturally captured long-tail searches like “who influenced [obscure band].” Fresh content from API updates kept the site relevant.
The SEO traffic created a virtuous cycle: more visitors → more cached data → faster site → better SEO.
Why It Ended
By 2019, the music APIs I relied on had changed their policies and pricing. Maintaining the integrations became unsustainable. Streaming services had also started integrating similar features, reducing the unique value proposition.
I sunset the project after six years of operation. The technical patterns I developed—especially the intelligent caching strategy—have influenced every project since.
What I Learned
Smart caching can make expensive operations affordable. The MongoDB proxy layer transformed an impossible cost structure into a sustainable one.
Visualization drives engagement. Users spent significantly more time exploring the graph than they would have with a simple list.
SEO compounds over time. The #1 rankings took years to build but created a sustainable traffic source.
API dependencies are fragile. External services change, and you need resilience built in from day one.
Explore archived versions on the Internet Archive.
Project Gallery
Key Metrics
Artist Records
900K+
Daily Users
2K
SEO Ranking
#1
Active Period
2013-2019
Technology Stack
Archived Project
This project is no longer active, but you can explore archived versions via the Internet Archive.
View on Web Archive